Average attendance
70k
Estimated per-show average in the consolidated dataset.
Tour analytics case
An interactive case built with Streamlit and a Python notebook to explore Oasis' reunion tour by date, city, country, estimated attendance, estimated gross, and setlist variants. The goal is to turn a CSV into a visual experience that feels like walking backstage at the tour.
Concerts
41
Dates consolidated inside the analyzed CSV.
Cities
17
The tour crosses the UK, the Americas, Asia, and Oceania.
Countries
11
Wide coverage for regional comparison.



Center
Oasis Live '25
Rhythm
25 songs on average
Effect
Dashboard with music context
Average attendance
70k
Estimated per-show average in the consolidated dataset.
Average gross
$12.8M
Estimated per show using the public Pollstar reference.
Variants
8
The setlist changes by city and by leg of the tour.
Tour window
Jul-Nov 2025
Visible CSV range: from July 4 to November 23, 2025.
Tour pulse
The tour opener sets the tone: one city, two nights, and a setlist that mixes anthems with nostalgia.
Date
July 4, 2025
Venue
Principality Stadium
Estimated attendance
70,000
Estimated gross
$12.7M
Setlist pulse
Songs that behave like the analytical backbone.
Notebook
01
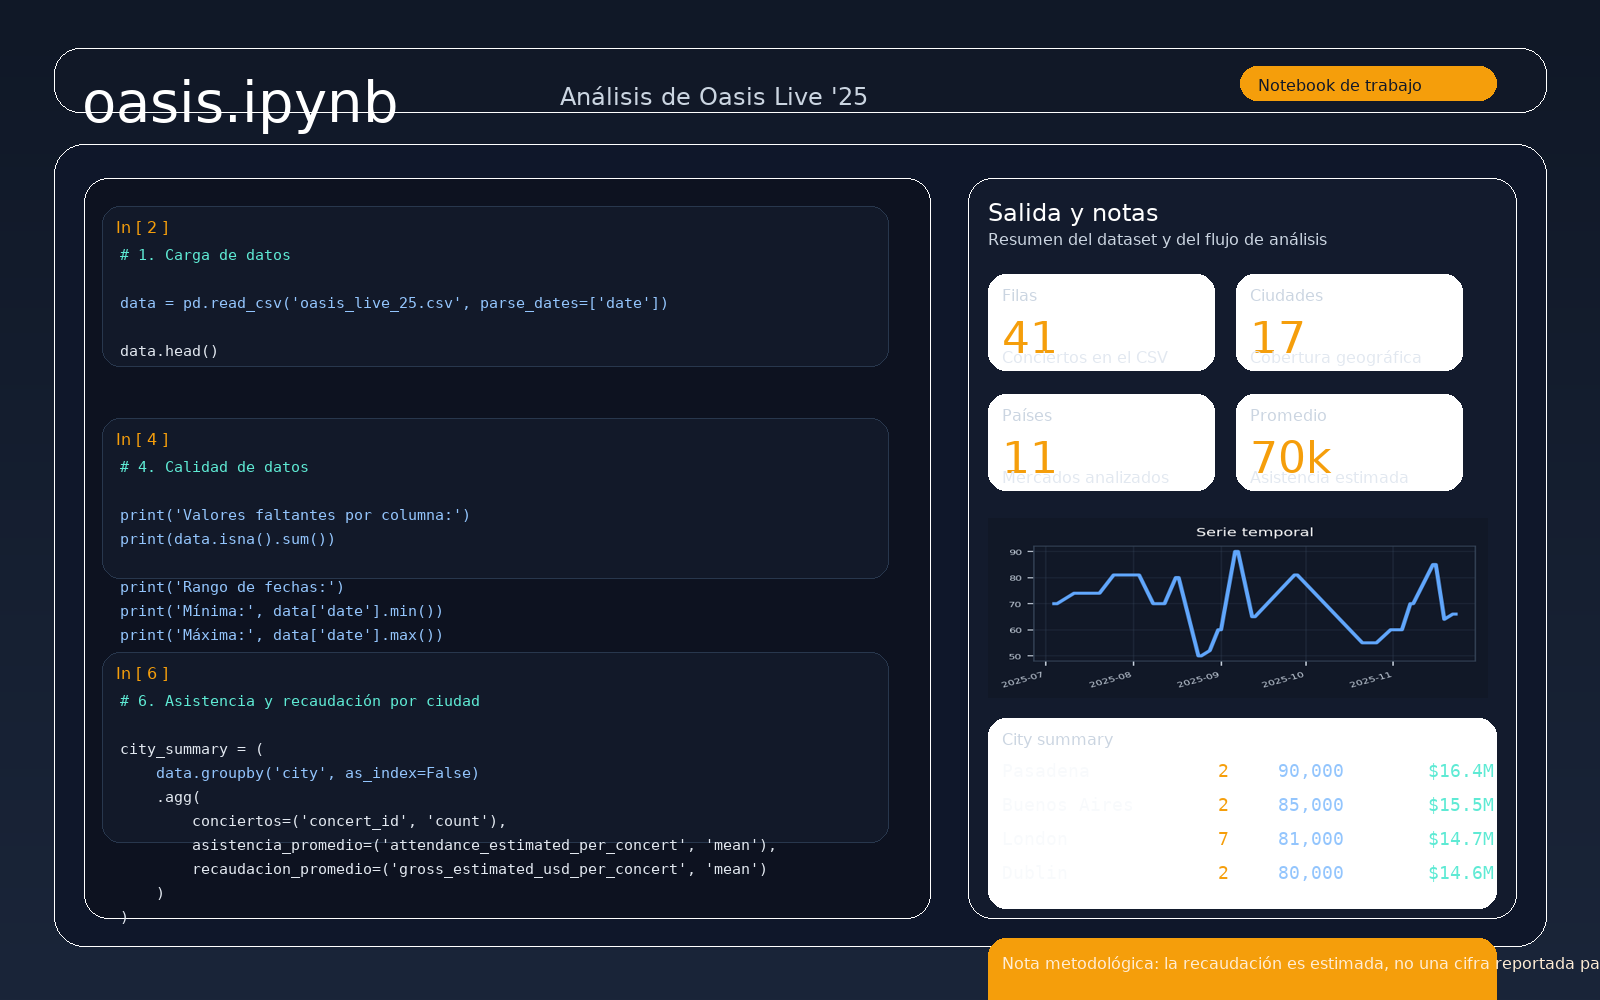
The notebook starts by reading oasis_live_25.csv and preparing the environment for dates and clean columns.
02
Nulls, types, date range, and consistency are checked before any insight is built on top of the data.
03
Attendance, gross, and setlist length become the base metrics for comparing the tour.
04
City-level analysis and the timeline help identify where the tour grows or shifts pace.
Streamlit
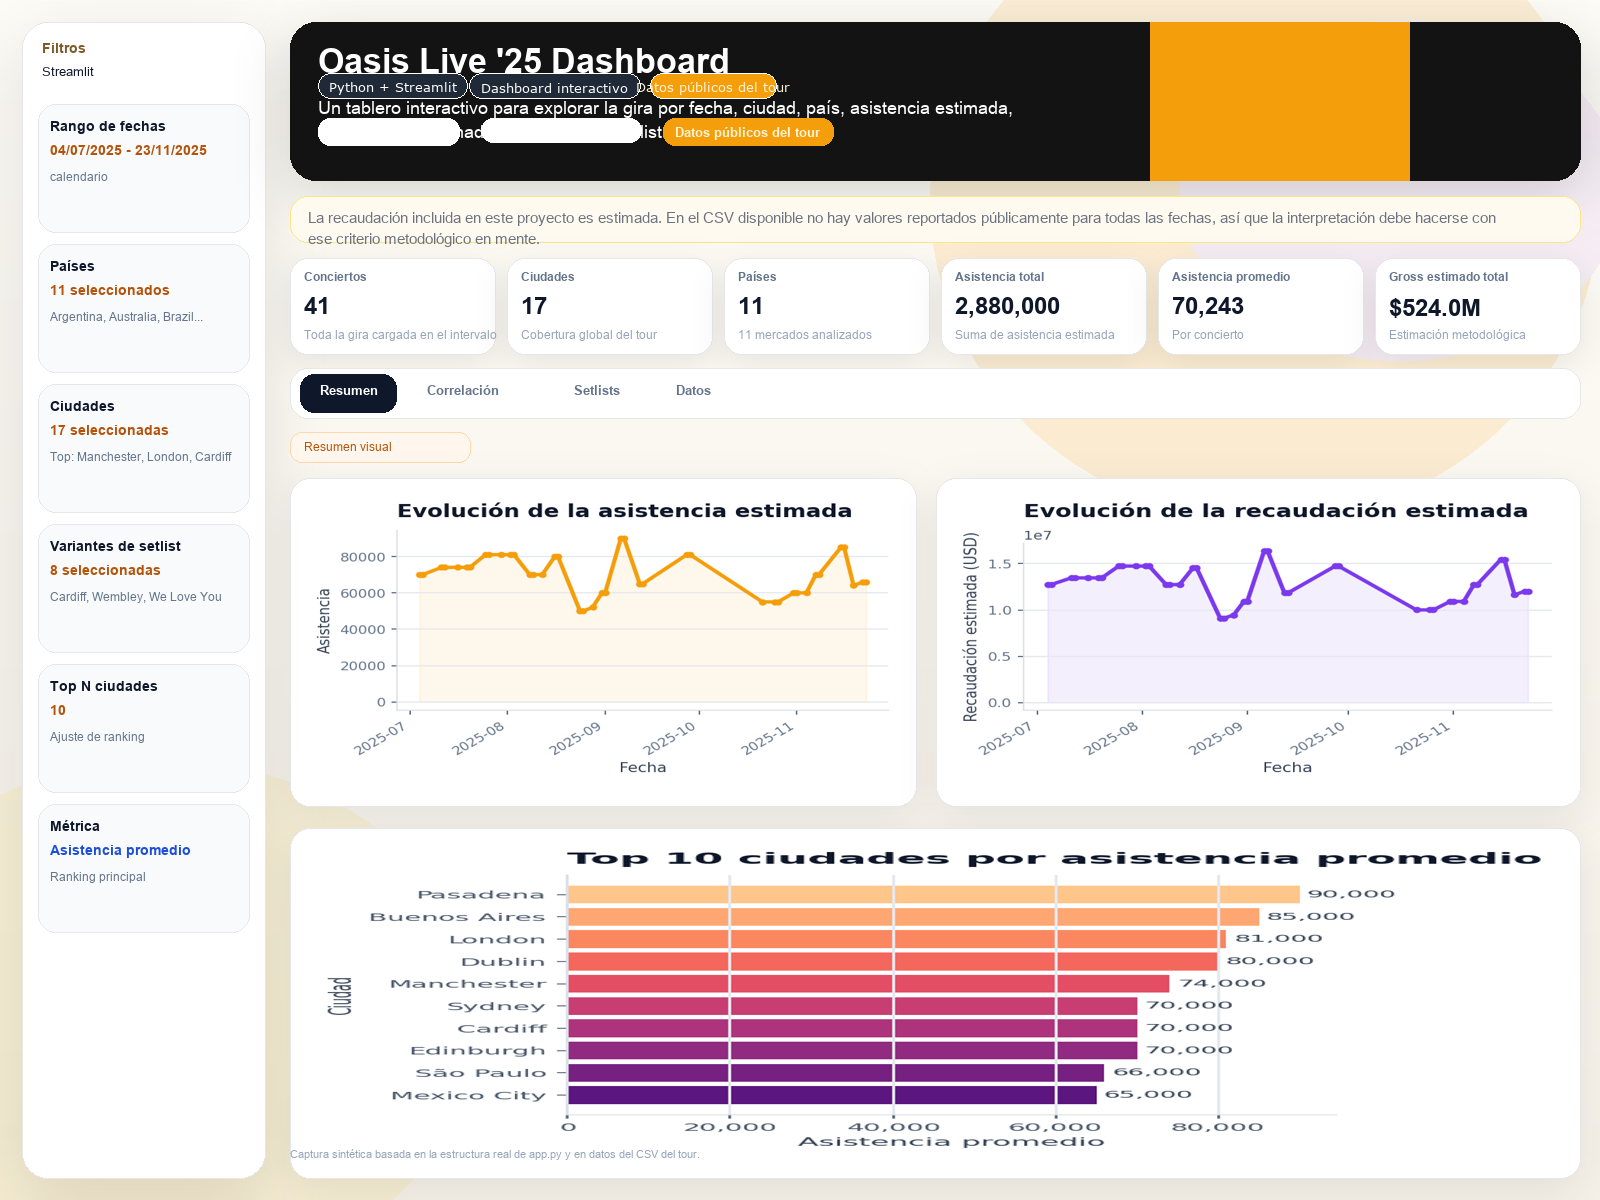
The Streamlit app filters the tour by date range, country, city, and setlist variant. From there, the user can read the key metrics, follow the time series, compare cities, and download the filtered subset.
Filters
Date, country, city, variant
KPIs
Concerts, attendance, and gross
Views
Timeline, ranking, and correlation
Output
Downloadable filtered subset
Feature map
What the app solves at a glance
Live navigation
The sidebar changes the view based on the selected range and filters.
Readable rankings
The best cities are sorted by attendance or gross.
Useful correlation
Attendance and gross are reviewed together to understand each stop.
Downloadable subset
Users can export exactly the slice of the tour they are exploring.
Method note
Gross is estimated rather than reported for every date. The dashboard shows that clearly so the reading stays rigorous.
Captures
It opens the portfolio because it blends music, data, and interactivity in a single piece. It shows that I can clean a dataset, turn it into a browsable app, and build a visual narrative that feels alive instead of merely informative.
All public images used here come from Wikimedia Commons.